One of the most critical skills a candidate has to show in the MBB recruitment tests is math.
After all, a consultant has to swim through a sea of data - filled with numbers, information, and assumptions - from the first day on the job. This is why math is a critical aspect of the MBB consulting recruitment process, both in online tests and case interviews.
This article will help you dive deeper into the difficulty of consulting math in MBB recruitment tests and how to pass those consulting math questions.
Overview of math difficulty in MBB recruitment tests
The difficulty varies among the different MBB recruitment tests.
For example, the McKinsey Solve only presents simple math problems in the Ecosystem Placement test and has more complex problems later in the Redrock Study Task. BCG Casey's question difficulty is on par with McKinsey’s Redrock.
Meanwhile, Bain Online Test presents a very different challenge at the advanced level, similar to (maybe even harder than) the old McKinsey PST test.
With those above in mind, we divide the math question in MBB consulting recruitment tests into three difficulty levels that correspond to the math skill of one candidate:
-
Basic level: Short and simple math problem
-
Intermediate level: Longer, simple math problem in business with chart/table
-
Advanced level: Long and complex math problem in business with chart/table
To have a chance to pass the MBB recruitment process, you will need to master the advanced level - which represents the most simple actual business math problems a consultant has to deal with.
There is one good news: Many candidates start at the intermediate level, thanks to the widening background acceptance of consulting firms. This is not to make you lazy - you still have much to train for, even when you find yourself at the advanced level.
Basic-level math problem - McKinsey’s Ecosystem test
You only have to deal with short and simple math problems at this level, using a simple formula and requiring a few calculating steps.
Examples of this math level are McKinsey’s Ecosystem Placement and Invasive Species. The candidate has to perform a series of simple calculations to determine whether the selected species will survive (Ecosystem Placement) or whether the invader will be eliminated before reaching the target (invasive Species).
Read more: McKinsey’s Solve Game Guides and Updates
Let’s look at the two examples related to McKinsey’s Ecosystem Placement and Invasive Species below.
McKinsey’s Invasive Species
Once a popular test, this game has fallen out of favor for the newer and harder Redrock Study Task. However, because the calculation in this game is more intuitive and clear-cut than Ecosystem Placement, we decided to make it an introductory example.
Below is a simple example of how math in McKinsey’s Invasive Species may be.
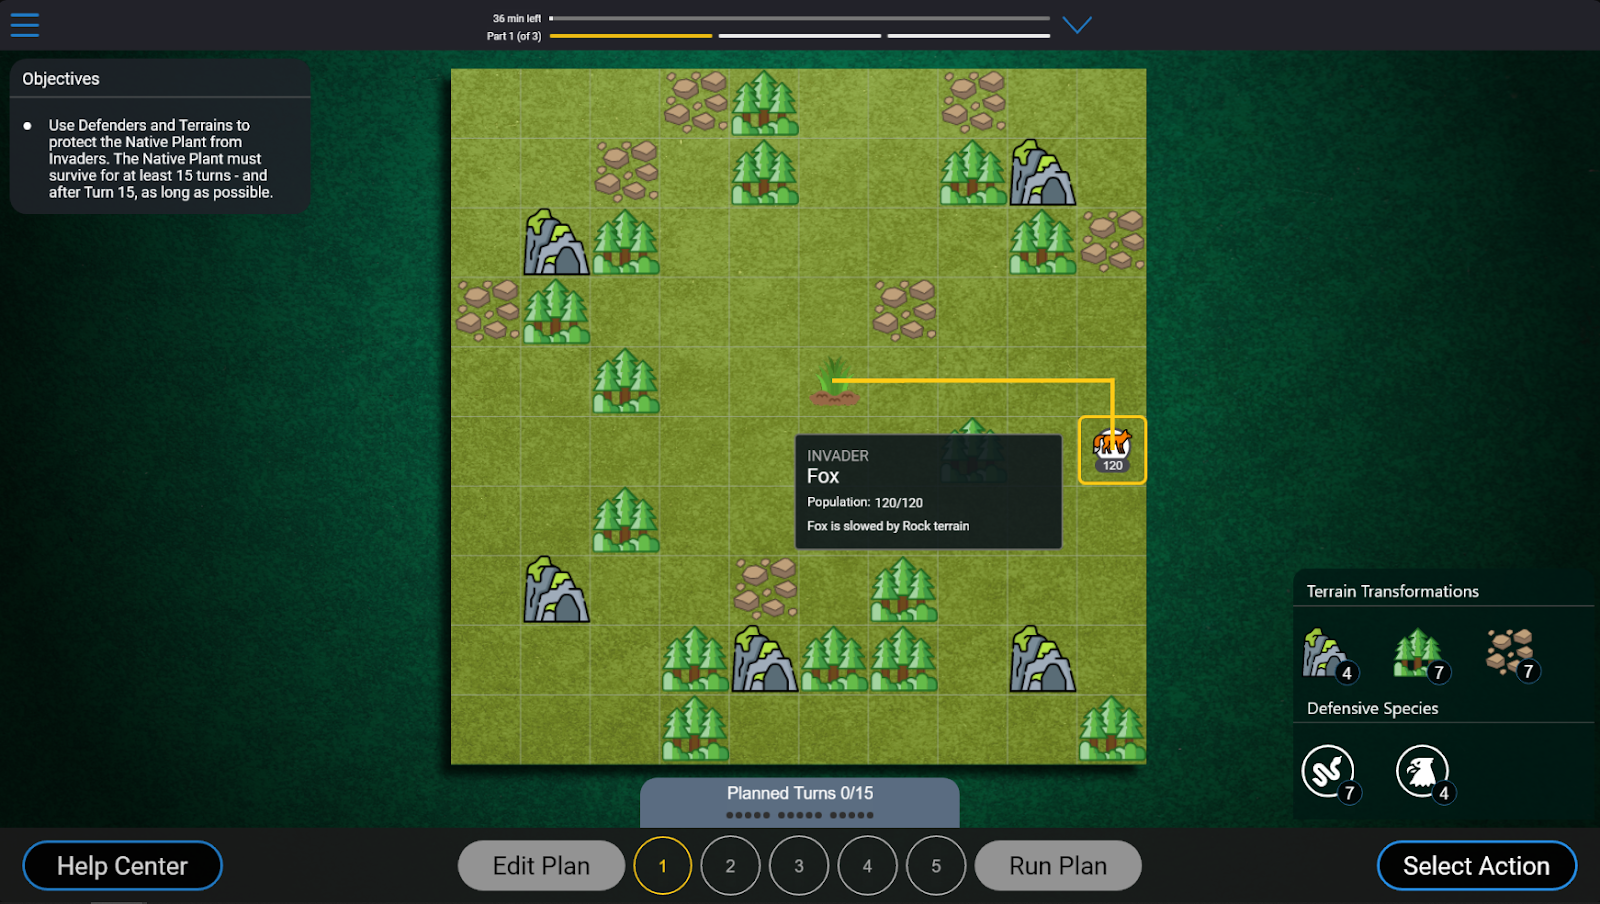
The invader is the Fox, with a population of 120. The Fox moves one square per turn, which means it will reach the target (a native plant) in four turns.
You have to deploy defensive species to destroy this invader before it reaches the target.
The two defenders you can use to stop the Fox are the Rattlesnake and the Falcon. The rattlesnake can damage 40 population of invaders per turn but can only cover one square. Falcon can only damage 20 population of invaders per turn, can only be placed on Forest, and are able to cover 14 squares.

Each defender took one turn to deploy, and only one defender can be deployed per turn. To be effective, you should use as few defenders as possible, as you will need the remaining defenders elsewhere when other invaders appear.
An effective plan can be like this:
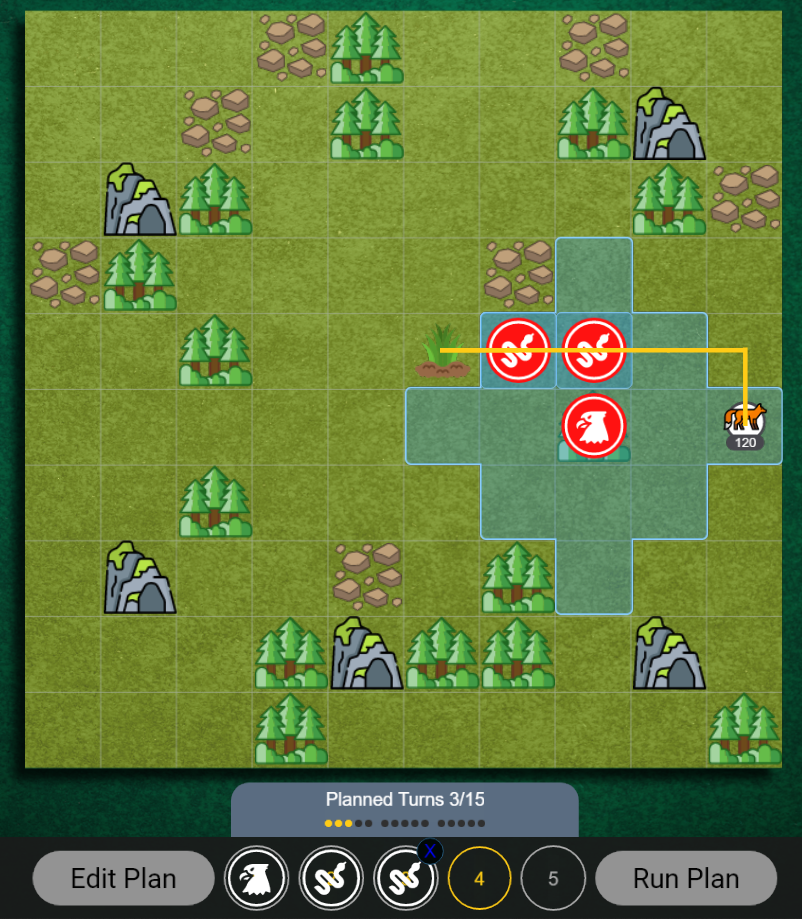
As you can see, we can use the forest near the target to deploy the Falcon, before deploy Rattlesnake close to the target native plant.
The Fox will move before the defenders are deployed, so in the first turn, the Fox will not take any damage. However, in the next three turns, Fox will have to take:
20 + (20 + 40) + (20 + 40) = 20 + 60 + 60 = 140 (damage)
Because this Fox only has 120 population, 140 damage from three defenders is more than enough. This is not to mention that one Falcon and two Rattlesnakes can cover 14 squares - which means even higher potential damage output against later invaders.
In comparison, if you use three Rattlesnakes to defend, you can only generate 120 damage and cover only three squares. Therefore, the native plant, in this case, is better protected using the former plan.
McKinsey’s Ecosystem Placement
Currently, McKinsey uses Ecosystem Placement and Redrock Study Task as the two main online entrance tests. The Ecosystem Placement game presents a harder challenge than the Invasive Species - candidates are required to organize information and take notes effectively to solve this game.
You have to sort through 39 species to build a sustainable ecosystem of only eight species. Many inexperienced candidates are overwhelmed by such a large amount of noise, so you must filter the noise first.
Through proper training, you will realize 39 species can be organized into three groups, which means you only have to work with 13 species at once to figure out the best choice from the three groups. Each group of 13 species always has ten animals and three producers.
A popular tip in the Ecosystem game is to pick three producers first because they do not need to eat any other species to survive and can usually provide a large amount of calories for other animals to live on.
With that, we only have to choose five from ten animals. Those ten animals can be further divided into three subgroups:
-
Apex: Cannot be eaten by other species in the group
-
Predator: Can eat any species in the group EXCEPT the Apex. Can be eaten by Apex.
-
Herbivore: Can only eat producer. Can be eaten by Apex and Predator.
The eating rule is:
-
Step 1: The animal with higher Calories Provided eats first
-
Step 2: It eats the species with the highest Calories Provided among its prey first.
Suppose the Calories Provided of the latter is higher than the Calories Needed of the former. In that case, the latter survives, with its Calories Provided subtracted by the Calories Needed of the former, and the Calories Needed of the former become 0.
However, if the Calories Provided of the latter is lower than the Calories Needed of the former, the latter is extinct, with its Calories Provided become 0, while the Calories Needed of the former is subtracted by Calories Provided of the latter. The former will keep eating according to the rule above, until its Calories Needed become 0.
Note: In some very rare situations, if there are two prey with the same Calories Provided, the eating species will eat from each of them an amount equal to 1/2 of its Calories Needed.
-
Step 3: After the first animal finishes eating, the cycle repeats for the remaining animals with the same rule, until every species has already eaten.
-
Step 4: At the end of this process, a species survives when its end-game Calorie Needed is equal to zero, and Calorie Provided is higher than zero.
Below is an example of an ecosystem with eight species. We will show you how a species can become extinct.
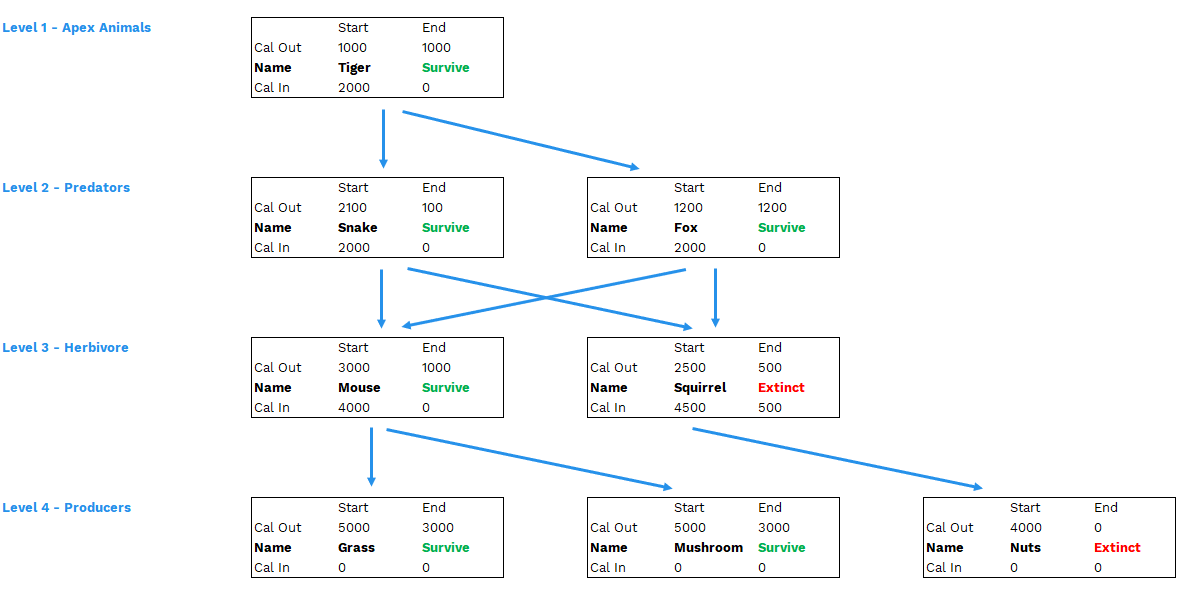
In the chart, Calories Provided is noted as “Cal Out”, and Calories Needed is noted as “Cal In”. The arrows indicate which species can be eaten by another (for example, Tiger has two arrows pointed toward Snake and Fox - that means Tiger can eat Snake and Fox only).
Applying the rules above, Squirrel and Nuts become Extinct. Nuts is eaten to extinction by Squirrel, while Squirrel does not have enough species to eat.
If you encounter this situation in the real test, you will have three options
-
Try to build another ecosystem with other species in the same group
-
Try to build another ecosystem with species of another group
-
Accept the current ecosystem
You must be flexible with those options. If your time is running out and you cannot devise a new and better ecosystem quickly, you should accept your current one. If you have lots of time remaining, you can go for the first two options.
Intermediate-level math problem - McKinsey’s Redrock and BCG Casey
At this level, the problem is more complex but remains understandable for non-business candidates. Compared to the basic level, an intermediate-level math problem has
-
Longer context, which may contain a chart/table
-
More complex formulas and more complex calculations
This math level is demonstrated in the popular McKinsey’s Redrock Study Task and BCG’s Casey Chatbot Interview. While Redrock’s questions are more research-oriented, BCG Casey’s are more business-oriented.
McKinsey’s Redrock Study Task
Read more: McKinsey Solve Game Newest Updates
Redrock Study Task (shortened as “Redrock”) test presents a harder challenge compared to Ecosystem Placement.
Redrock requires good data reading and interpretation, numerical reasoning, and verbal reasoning – similar to skills required in a consultant.
Candidates have to go through two parts in 35 minutes: one case study and ten mini-questions.
In the first part, candidates have to collect relevant data to address the study objectives before analyzing them by answering 5-6 math questions before summarizing them into one report with visualization charts and conclusions.
Each question may contain 2-3 smaller questions, each of them is the result of 5-6 calculation steps and some simple formulas.
While solving the math question itself is not very hard, you have to go through a sea of data to figure out which is relevant for you to collect. Speed is important, but remember that you have to answer correctly too.
Below is an example of how math in McKinsey’s Redrock Study Task may be in part 1.
Note:
-
Our examples are not an exact copy of the real test but only follow the core logic we discovered through reports of many candidates
-
The same context will be used for every question in the first part of Redrock, so do not worry if you find the one below too long.
Context
Objectives: Determines whether a relocation plan of the competing hyenas can help the lion packs at Humbleland maintain their population
Humbleland Conservation Site has five packs of lions: Musafa, Sambi, Monti, Bumpaa, and Kafiri. For many years, the lion has preyed on zebras and maintained a consistent population.
However, this year, a pack of hyenas from a nearby savanna has moved into Humbleland.
The arrival of these hyenas caused intense competition with the lions, reducing the number of hunts for all five packs. The hyenas are especially threatening to the Monti, Bumpaa, and Kafiri packs, whose territories are now being taken over slowly by the hyenas.
Estimates for the number of zebra hunts for the Monti and Bumpa packs are as follows:
- Monti's hunts growth from Y-1 to Y will decrease by 10 percentage points compared to growth from Y-2 to Y-1.
- Bumpaa's hunts growth from Y-1 to Y will decrease by 12 percentage points compared to growth from Y-2 to Y-1.
- Kafiri's hunts growth from Y-1 to Y will decrease by 5 percentage points compared to growth from Y-2 to Y-1.
As such, local conservationists decided to intervene by capturing and moving the hyenas to another conservation site. They hope that this would restore the territory and source of prey for the Monti, Bumpa, and Kafiri packs.
The conservationists estimate that, after the relocation has been completed:
- Monti's number of hunts will go up by 15 percent compared to the original estimate (without hyenas relocation).
- Bumpaa's number of hunts will go up by 20 percent compared to the original estimate (without hyenas relocation).
- Kafiri's number of hunts will go up by 5 percent compared to the original estimate (without hyenas relocation).
Exhibit 1: Number of hunts for the Humbleland lion packs in 5 years before the hyena invasion.
|
Year Y-5 |
Year Y-4 |
Year Y-3 |
Year Y-2 |
Year Y-1 |
|
|
Musafa |
51 |
55 |
56 |
60 |
72 |
|
Sambi |
10 |
14 |
16 |
20 |
25 |
|
Monti |
22 |
23 |
25 |
25 |
29 |
|
Bumpaa |
24 |
26 |
30 |
32 |
36 |
|
Kafiri |
35 |
36 |
39 |
40 |
44 |
Exhibit 2: Minimum required number of hunts for Year Y (to sustain lion population)
|
Lion pack |
Hunts required |
|
Musafa |
75 |
|
Sambi |
32 |
|
Monti |
35 |
|
Bumpaa |
40 |
|
Kafiri |
48 |
Question: Estimate the number of hunts for the Monti, Bumpaa, and Kafiri packs without the relocation program in Year Y.
Below is the answer to the question.
Step 1: Calculate the hunt growth rate from Y-2 to Y-1
Hunt growth rate from Y-2 to Y-1 for each pack
= ((Number of hunts in Y-1 / Number of hunts in Y-2) - 1) * 100
From the formula above, we have:
-
Hunt growth rate for Monti pack = (29 / 25 - 1) * 100 = 16%
-
Hunt growth rate for Bumpaa pack = (36 / 32 - 1) * 100 = 12.5%
-
Hunt growth rate for Kafiri pack = (44 / 40 - 1) * 100 = 10%
Step 2: Calculate the hunt growth rate from Y-1 to Y, without the relocation program
Without the relocation program:
-
Monti's hunts growth from Y-1 to Y will "decrease by 10 percentage points" compared to growth from Y-2 to Y-1
=> The hunt growth rate for Monti from Y-1 to Y, without relocation, is 16 - 10 = 6%
-
Bumpaa's hunts growth from Y-1 to Y will "decrease by 12 percentage points" compared to growth from Y-2 to Y-1.
=> The hunt growth rate for Bumpaa from Y-1 to Y, without relocation, is 12.5 - 12 = 0.5%
-
Kafiri's hunts growth from Y-1 to Y will "decrease by 5 percentage points" compared to growth from Y-2 to Y-1.
=> The hunt growth rate for Kafiri from Y-1 to Y, without relocation, is 10 - 5 = 5%
Step 3: Calculate the number of hunts for each pack, without the relocation program
Number of hunts for each pack in Year Y, without relocation
= Number of hunts for each pack in Year Y-1 * (1 + Hunt growth rate from Y-1 to Y)
From the formula above, we have:
-
Number of hunts for Monti in Year Y, without relocation = 29 * (1 + 6%) = 30.74 (hunts)
-
Number of hunts for Bumpaa in Year Y, without relocation = 36 * (1 + 0.5%) = 36.18 (hunts)
-
Number of hunts for Kafiri in Year Y, without relocation = 44 * (1 + 5%) = 46.2 (hunts)
In the second part, candidates have to answer ten math questions, involving choosing suitable charts, suitable formula, and of course, the standard calculation question.
The question is shorter and more simple, however, one thing you may realize that is the tighten time constraints. For example, if you spend 15-20 minutes on the first part, you will have 15-20 minutes for the remaining ten questions. That means, on average, you only have 1.5-2 minutes for each question!
However, always remember: Accuracy is more important than speed. In other words, you should focus on getting each Redrock question done correctly instead of just rushing through, hoping you can finish all those questions.
Of course, being too slow is not good. Hence, you have to keep practicing to improve your speed and accuracy.
Anyway, below is an example on how a question in part 2 may look like.
Context:
Lightland conservationists are calling for donations to fund their conservation projects.
The following exhibit outlines the plan for the donations.
Exhibit 1. Manhour and success rate for each donation option
|
Option |
Donation amount ($) |
Manhours per successful donation (hrs) |
Success rate per potential donor (%) |
|
1 |
1,000 |
20 |
20 |
|
2 |
2,000 |
50 |
10 |
|
3 |
5,000 |
80 |
5 |
Exhibit 2. Required successful donations for each plan
|
Option |
Donation amount ($) |
Plan A |
Plan B |
|
1 |
1,000 |
50 |
30 |
|
2 |
2,000 |
25 |
10 |
|
3 |
5,000 |
10 |
20 |
*Note: Success rate indicates the possibilities of successfully securing a donation amount from a potential donor
Question: If the donation team has two full-time members (40 hours per week each), and four part-time members (25 hours per week each), which plan would take less time to complete? How many weeks will it take?
Answer: Plan B
To compare the required time, in terms of weeks, needed to complete the plan, first we need to calculate the total manhours to achieve the number of required successful donations for each plan.
Step 1: Calculate manhours needed for each plan
Total manhours needed for each plan
= Sum of product of (Required successful donations for each donation option * Manhours per successful donation)
-
The total manhours needed for plan A = (50 * 20) + (25 * 50) + (10 * 80) = 3,050 hrs
-
The total manhours needed for plan B = (30 * 20) + (10 * 50) + (20 * 80) = 2,700 hrs
Step 2: Calculate the required weeks it takes to complete a plan
The required weeks it takes to complete a plan
= Total manhours for a plan / Total manhours per week (*)
The total manhours per week is:
Total manhours per week = Full-time manhours + Part-time manhours
= 40*2 + 25*4
= 180 manhours per week
From there, using formula (*)
-
The required weeks to complete plan A = 3,050 / 180 = 16.944 weeks
-
The required weeks to complete plan B = 2,700 / 180 = 15 weeks
In conclusion, plan B would take less time to complete the donation campaign with 15 weeks.
BCG’s Casey Chatbot Interview
Read more: BCG Online Case Chatbot Guide
BCG’s Casey Chatbot Interview presents a business context. In comparison to McKinsey’s Redrock above, the case context in BCG Casey is more similar to the second part, with short and concise case context.
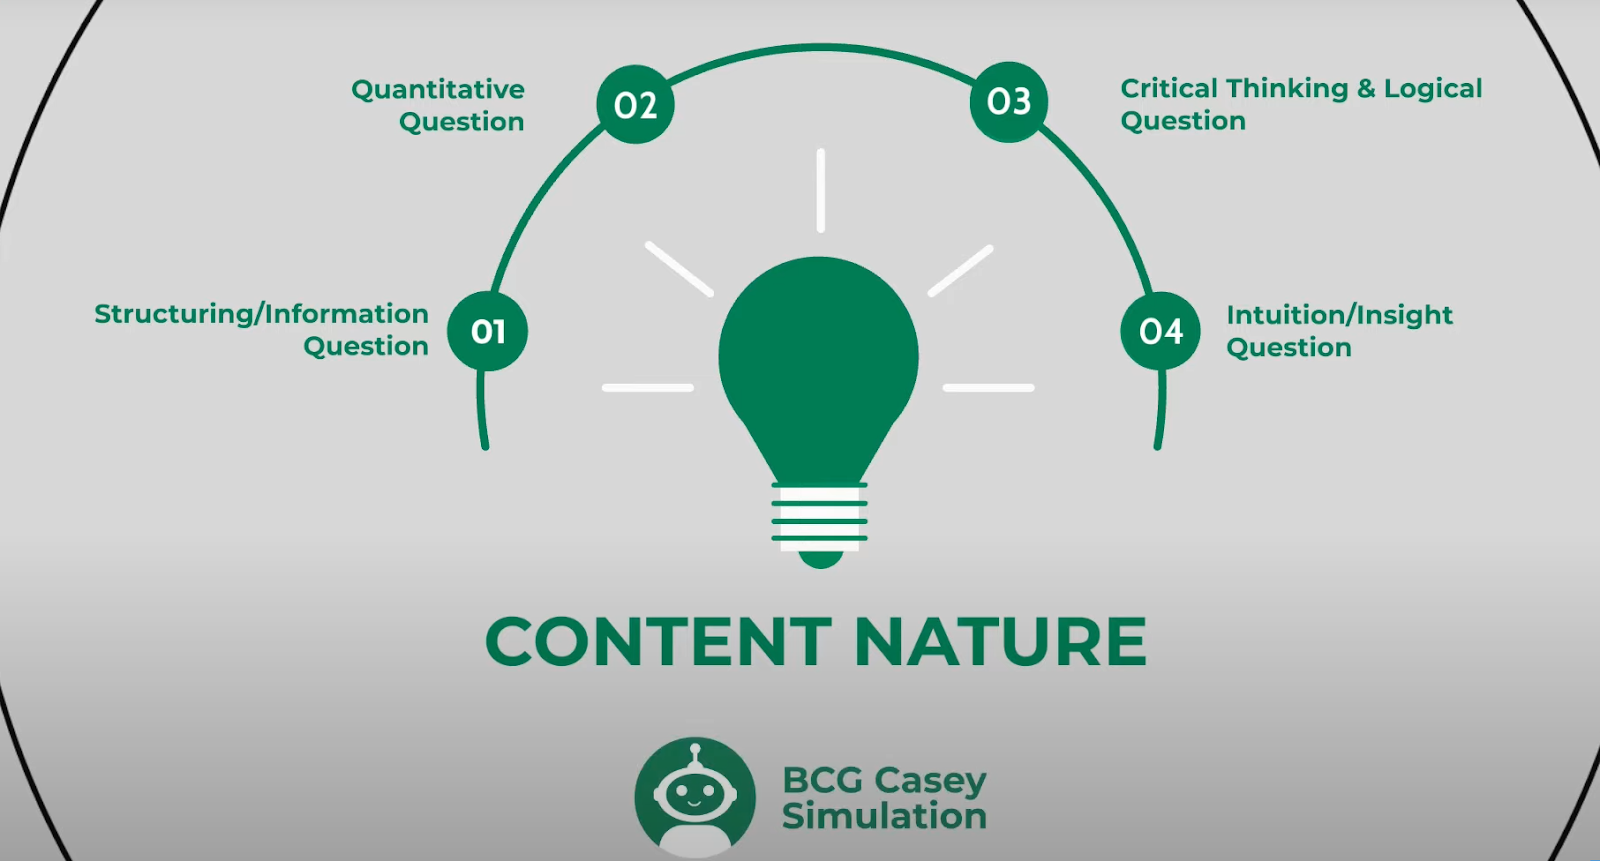
The BCG Casey test lasts 25-30 minutes, with 6-8 questions. Four types of questions are Structuring question, Quantitative question, Logical question, and Insight question. Most of the math problems in BCG Casey are concentrated in the Quantitative question type.
There are four types of answer formats that in the test, including: Multiple-select multiple choice, Single-select multiple choice, Long-text freeform, and Short-text freeform. Each answer format will typically have different material and approach methods.
An example math question in BCG Casey would be like this.
Question:
Effect of economies of scale on profit margin (scale effects) in the budget airline industry is: For every 1% of the market share each company has, 0.2% is added into the profit margin.
Market share, profit margins, and scale effects for the top 5 budget airlines in Columbia is displayed in the following exhibit.
|
Airline |
Market share (by revenue) |
Profit margin (before scale effects |
Scale effects |
Profit margin (after scale effects) |
|
Jetlag |
29.7% |
4.5% |
5.9% |
10.4% |
|
Grounded |
19.2% |
3.4% |
3.8% |
7.2% |
|
Turbulence |
16.4% |
5.6% |
3.3% |
8.9% |
|
Overbooked |
11.7% |
4.1% |
2.3% |
6.4% |
|
Delayed |
10.6% |
4.9% |
2.1% |
7.0% |
Calculate the expected final profit margin for Grounded Turbulence.
Answer: 8.0%
Explanation:
This is a Quantitative question, of the Short-text answer format. To answer this question, we follow the 3 steps below:
Step 1: What is the combined profit margin Grounded Turbulent, before scale effects?
In terms of contribution to the merged entity’s market share
Grounded / Turbulent = 19.2 / 16.4 = 54 / 46
Considering the weight of each merging entity
Combined profit margin = (3.4 * 54%) + (5.6 * 46%) = 4.4 (%)
Step 2: What is the estimated scale effects on profit margin of Grounded Turbulent after merging?
Total market shares after merging, by revenues:
19.2 + 16.4 = 35.6 (%)
Effect of economies of scale on profit margin on Grounded Turbulent :
35.6 * 0.1 = 3.6 (%)
Step 3: Finally, what is the profit margin after scale effects of Grounded Turbulent?
Final profit margin = 3.6 + 4.4 = 8.0 (%)
If you can calculate correctly quickly and are familiar with multiple types of charts but lack business intuition, that means you are at the intermediate level. In fact, many candidates start at this level when they begin their training, considering the broadening acceptance of backgrounds for a consulting career.
However, to ensure a chance of success in the test and later case interview, you must learn to master the advanced level, which we will talk about below.
Advanced-level math problem - Bain Online Tests
At this level, you will encounter complex business problems with tables, charts, and complex formulas and calculations. This level resembles the daily math problems a consultant has to deal with.
Bain Online Test is famous for its difficulty. Many compares it to the old McKiseny PST, some even said Bain test is even more harder than PST.
Bain Online Test
Read more: Bain Online Test Guide
Bain Online Test or Bain Online Assessment is a collection of pre-interview screening tests used by Bain & Company.
It assesses the candidate on verbal, numerical and logical reasoning, often using 25-30 multiple choice questions done in 30-50 minutes. The tests are computer-based, although some offices require physical attendance at proctored sites.
It is worth noting that Bain Online Test is not a uniform test applied in all offices across the world. The test designer, format, and specific question types all vary from place to place. Additionally, very little official information is disclosed, making it difficult to prepare.
According to our reports, currently, the Bain Online Test may include the following components:
-
Aptitude Test: tests the cognitive abilities of the candidate (logical, numerical, and verbal reasoning), similar to common aptitude tests available online.
-
Personality Test: requires the candidate to rate “most likely” and “least likely” on given traits to decide their “fit” with Bain culture and consulting job nature.
-
Analytical Test: this format is based on the GMAT, with questions on critical reasoning, data sufficiency, and problem-solving.
-
Business Case Test: this format presents a full business case along with multiple-choice questions – similar to the McKinsey PST and BCG Potential Test.
-
One-Way Video Interview: this is not so much a “test”, but in certain offices, it does appear during the testing round, so make sure to prepare yourself; this interview includes both behavioral and case questions.
The focus of this article is math, so we will concentrate on the “Business Case Test” component of Bain Online Test.
This format is quite similar to the old McKinsey PST and BCG Potential Test. The test is chart-heavy, much like real consulting presentations. Each case is accompanied by 5-7 charts. You can get a glimpse in the screenshot below:

Four types of questions exist in business case test:
-
Reading facts questions require the candidate to read and understand data (in this case, mostly charts and numbers), then choose a statement that accurately reflects the data.
-
Math word problems require the candidate to perform complex calculations – don’t worry, they are no harder than school math, but you do need to be careful handling big numbers.
-
Fact-based conclusion questions are similar to deductive reasoning – using facts to identify correct/incorrect statements in a given set.
-
Solution-recommendation questions ask the candidate to choose an alternative from a given set, based on the data in the case.
To better illustrate the difficulty of advanced-level math problem, here is our example:
Context
Open Wings Airline (OWA), founded in 2005, is a low-cost airline headquartered in Germany with two hubs located in Munich and Cologne. The company has been profitable since its establishment but has experienced flat profit growth for the past few years.
Concerning this problem, the CEO of OWA is considering African safari as a potential market to enter within the next year. A safari is an overland journey, usually a trip by tourists to either hunt or observe and photograph wildlife. According to the CEO, the primary goal of this entry is to increase OWA’s annual profit.
There are 3 options to enter this new market for OWA:
- No.1 is to build this business from scratch
- No.2 is to acquire a local experienced company and lastly
- No.3 is outsourcing. By outsourcing, OWA will contract with a local company to provide safari tours but brand to make them appear as OWA provides them. This partner will be considered a white-label company.
Prefer to have the new business entirely under control, the CEO thus prioritizes the first option. The following shows the tour information and projected costs to OWA if it decides to start from nothing.
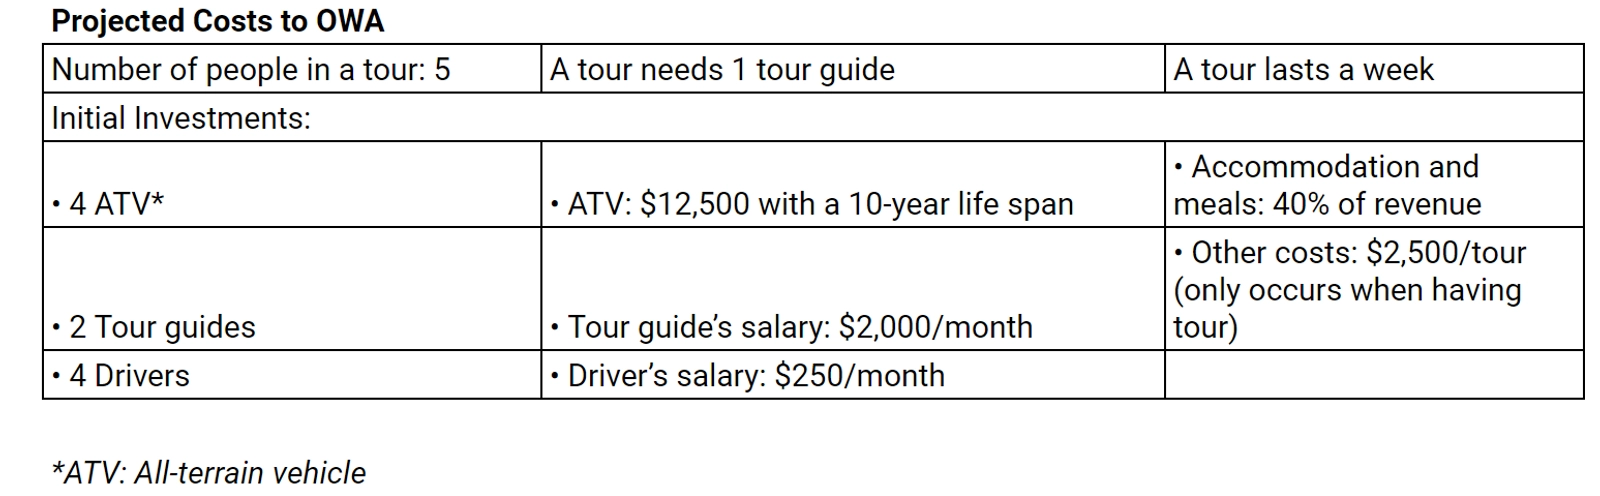
Question: Given the tour price is $10,000 in total, how many tours OWA must operate at least in order for this business line to be profitable within the first year?
Answer: 32 tours
Explanation:
Step 1: Formulate the process to calculate the number of tours in the first year.
To answer this question, let me compute the breakeven point for OWA, where the total revenue equals the total costs. The minimum number that is greater than the breakeven point will be the minimum number of tours required for OWA to be profitable in the first year.
Now let’s first set up the equation, starting from the basis equation of breakeven:
Revenue in Y1 = Cost in Y1 (i)
Wherein:
(1) Let X be the number of tours in the first year.
Revenue in Y1 = Price per tour * No. of tours = $10,000* X
(2)
Cost in Y1 = Fixed costs + Variable costs
= (ATV cost + Tour guides cost + Drivers cost) + (Accommodation and meals + Other costs)
= (ATV price * Number of ATVs + Tour guide monthly salary * Number of tour guides * Number of months + Driver monthly salary * Number of drivers * Number of months) + (Accommodation and meals + Other costs (ii)
Step 2: Calculation
Applying numbers in equation (ii), we have:
= ($12,500 * 4 + $2,000 * 2 * 12 + $250 * 4 * 12) + (40% * Revenue in Y1 + $2,500 * X)
= ($50,000 + $48,000 + $12,000) + (40% * $10,000 * X + $2,500 * X)
= $110,000 + $6,500* X
Plug numbers equation (i), we have:
$10,000 * X = $110,000 + $6,500 * X
$3,500 * X = $110,000
X = $110,000 /$3,500 = 31.439 ~ 32 tours
The minimum number of tours required in a year is 32 tours
If you find yourself comfortable going through this example or similar problems, congratulations! You have earned a competitive edge in the actual case interview.
However, no matter how good you are, remember...
Keep training!
It is worth remembering that in the actual interview, some good candidates cannot handle case questions in a consulting way because of the pressure - a small mistake in a normal situation can be the beginning of an epic fail in a pressured situation.
The interviewer won’t care if you brand yourself a mathematician yet cannot solve a simple math question. The interviewer won’t care if you feel pressured - consulting is a pressured profession; take it or leave it.
That is why you must keep training, even if you are in seemingly good shape.
Through extensive training, you will encounter complicated situations that resemble tricky situations in the real case interview and future consulting work. Therefore, you can better brace yourself if you encounter such problems later.
With that in mind, at MConsultingPrep, we have developed this Comprehensive Math Drills package to help you train with consulting math.
Our package provides a coursebook and a wide range of training sessions, including a free mental math course and +600 math drill exercises.
-
Mental Math Drills: This free course will help you train and refine mental math skill. Speed is important, but you must also make sure your result is as close to the exact result as possible.
-
Math Drills Exercise: This course includes +600 exercises that are divided into three sections - Short context exercise (Basic-level math), Long context exercise (Intermediate-level math), and Case math exercise (Advanced-level math).
Practice now with our Comprehensive Math Drills!
Sign up to access our free Mental Math Drill tool here.
/filters:quality(75)//case_thumb/1669868086132_comprehensive_math_drills.png)